A combination of three variables, as well as wind vectors and location markers,
could be plotted by PostWRF.
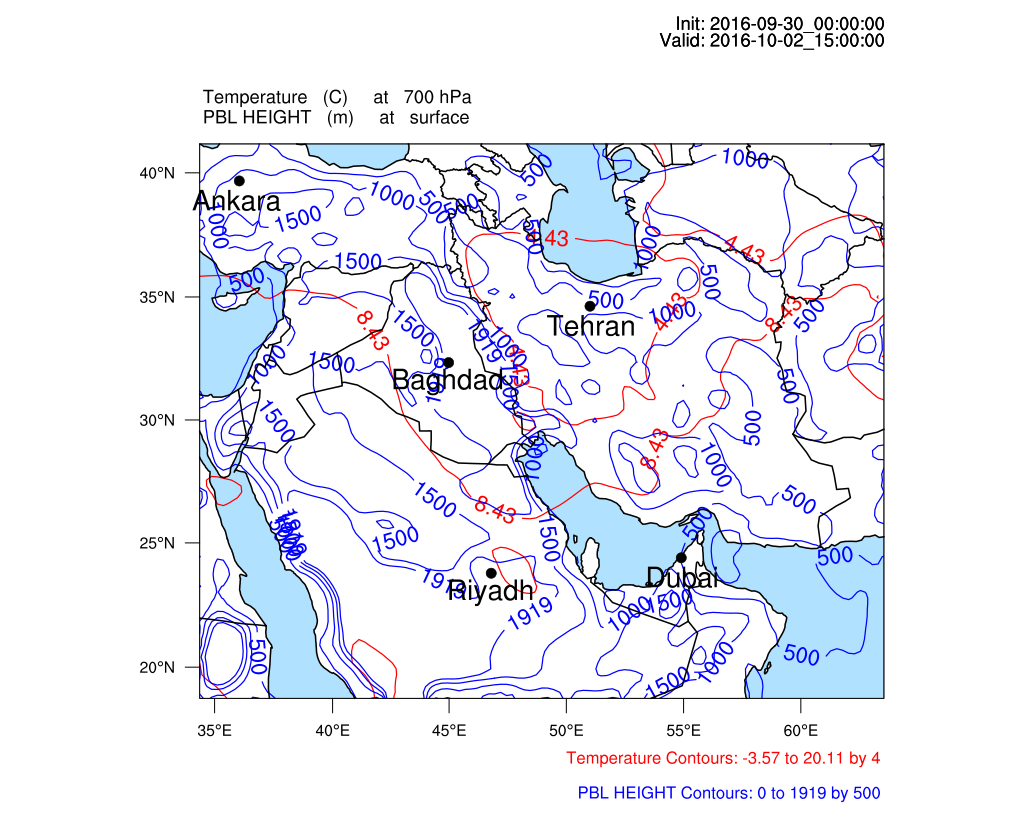
Example 1
Two line contours plus the locations of some points
(specified in ‘Data extraction’ section of namelist.wrf):
================ CONTOUR PLOT =================
=============================================
CONTOUR_ON_OFF = 1
!!! Variable_1 by line contours !!!
1st_Variable_on_off = 1
1st_Variable_name = tc
1st_Variable_pressure_level = 700
1st_Variable_intervals = 4
1st_Variable_line_color = red
1st_Variable_line_thickness = 0.5
1st_Variable_label_size = 0.5
!!! Variable_2 by (broken) line contours !!!
2nd_Variable_on_off = 1
2nd_Variable_name = PBLH
2nd_Variable_pressure_level = 0
2nd_Variable_intervals = 500
2nd_Variable_line_color = blue
2nd_Variable_line_thickness = 0.5
2nd_Variable_label_size = 0.5
2nd_Variable_brokenline_on_off = 0
!!! Variable_3 by filled (colored) contours !!!
3rd_Variable_on_off = 0
3rd_Variable_name = pvo
3rd_Variable_pressure_level = 0,
Wind_Vectors_on_off = 0
Wind_Vectors_pressure_level = 700
Wind_Vectors_speed (m/s) = 5
Wind_Vectors_density = 0.5
Wind_Vectors_color = blue
Wind_Vectors_thickness = 0.5
Location_point_mark_on_off = 1
Location_labels_on_off = 1
Location_labels_size = 0.2
Location_labels_color = black
Shapefile_on-off = 0
Shapefile_path = /home/ah/postwrf/modules/iran_provinces/all.shp
————————————————————————————————-
Output image at a specific time-slot in the WRF output is as bellow:
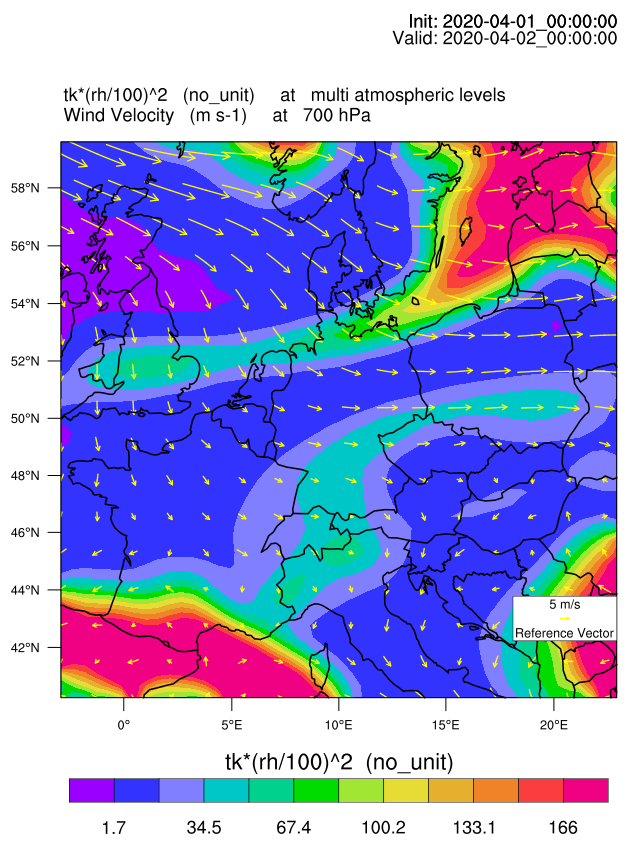
Example 2
Shaded contour of a polynomial (tk * (rh/100)^2)
During the processing, several questions, such as the color pattern of
the contours, name and unit of the polynomial, and file format will be asked from the usr.
The user can specify a pressure level for each variable names, with exactly
the same number as the variable names (2 values, corresponded to tk and rh for this example).
If only one value is set for 3rd_Variable_pressure_level, all the variables
(tk and rh) will be plotted at the same pressure level.
================ CONTOUR PLOT =================
=============================================
CONTOUR_ON_OFF = 1
!!! Variable_1 by line contours !!!
1st_Variable_on_off = 0
1st_Variable_name = tc
1st_Variable_pressure_level = 500
1st_Variable_intervals = 3
1st_Variable_line_color = red
1st_Variable_line_thickness = 0.7
1st_Variable_label_size = 0.7
!!! Variable_2 by (broken) line contours !!!
2nd_Variable_on_off = 0
2nd_Variable_name = T2
2nd_Variable_pressure_level = 0
2nd_Variable_intervals = 0
2nd_Variable_line_color = brown
2nd_Variable_line_thickness = 0.7
2nd_Variable_label_size = 0.7
2nd_Variable_brokenline_on_off = 1
!!! Variable_3 by filled (colored) contours !!!
3rd_Variable_on_off = 1
3rd_Variable_name = tk * (rh/100)^2
3rd_Variable_pressure_level = 650, 700
Wind_Vectors_on_off = 1
Wind_Vectors_pressure_level = 700
Wind_Vectors_speed (m/s) = 5
Wind_Vectors_density = 0.5
Wind_Vectors_color = yellow
Wind_Vectors_thickness = 0.7
Location_point_mark_on_off = 1
Location_labels_on_off = 1
Location_labels_size = 0.2
Location_labels_color = black
Shapefile_on-off = 0
Shapefile_path = /home/ah/postwrf/modules/iran_provinces/all.shp
————————————————————————————————-
Output image at a specific time-slot in the WRF output is as bellow:
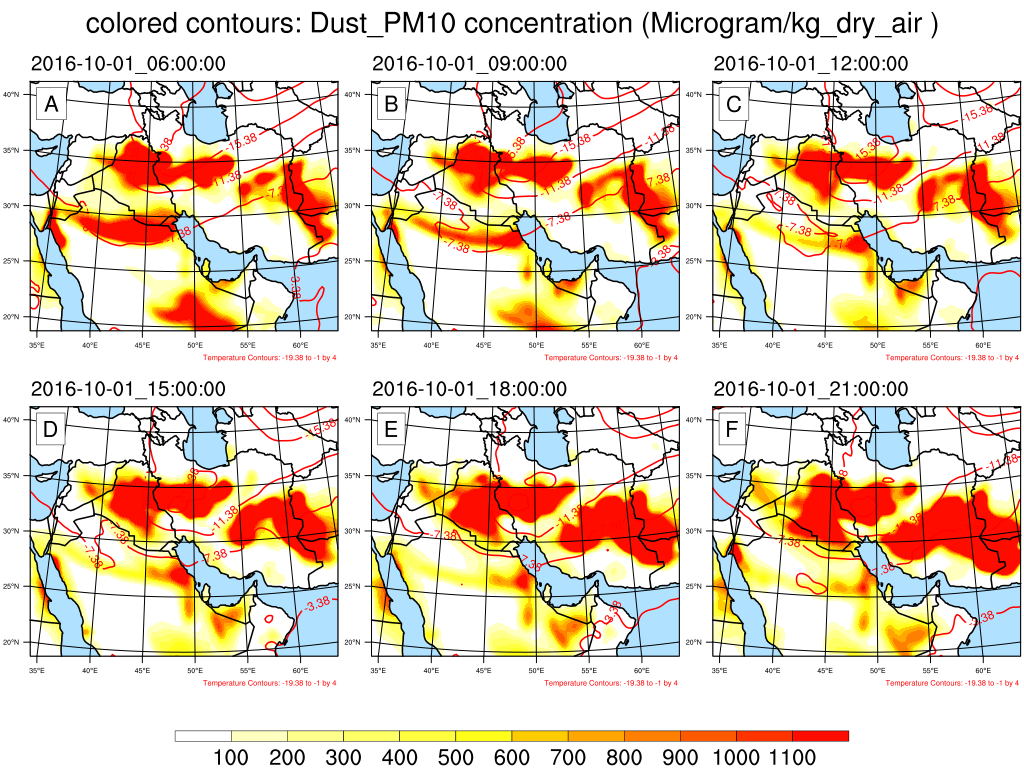
Example 3
Panel plot of a shaded and a line contour
================ CONTOUR PLOT =================
=============================================
CONTOUR_ON_OFF = 1
!!! Variable_1 by line contours !!!
1st_Variable_on_off = 1
1st_Variable_name = tc
1st_Variable_pressure_level = 500
1st_Variable_intervals = 4
1st_Variable_line_color = red
1st_Variable_line_thickness = 0.7
1st_Variable_label_size = 0.7
!!! Variable_2 by (broken) line contours !!!
2nd_Variable_on_off = 0
2nd_Variable_name = T2
2nd_Variable_pressure_level = 0
2nd_Variable_intervals = 0
2nd_Variable_line_color = brown
2nd_Variable_line_thickness = 0.7
2nd_Variable_label_size = 0.7
2nd_Variable_brokenline_on_off = 1
!!! Variable_3 by filled (colored) contours !!!
3rd_Variable_on_off = 1
3rd_Variable_name = dust_pm10
3rd_Variable_pressure_level = 0
Wind_Vectors_on_off = 0
Wind_Vectors_pressure_level = 700
Wind_Vectors_speed (m/s) = 5
Wind_Vectors_density = 0.5
Wind_Vectors_color = yellow
Wind_Vectors_thickness = 0.7
Location_point_mark_on_off = 0
Location_labels_on_off = 1
Location_labels_size = 0.2
Location_labels_color = black
Shapefile_on-off = 0
Shapefile_path = /home/ah/postwrf/modules/iran_provinces/all.shp
————————————————————————————————-
Panel plot is a capability of PostWRF which must be set in
the General settings section of namelist.wrf
============== GENERAL SETTINGS ===============
=============================================
spin-up_time (hours) = 12
averaging_on_off = 0
average_time (hours) = 12
panel_plot__on_off = 1
panel_plot__rows_number = 2
panel_plot__columns_number = 3
smooth_maps_on_off = 1
map_borderline_color = black
map_borderline_thickness = 0.7
map_filled_ocean_on_off = 1
map_gridlines_on_off = 1
plot_titles_on_off = 0
————————————————————————————————-
Output image at a specific time-slot in the WRF output is as bellow: