Note
Line colors, font sizes, etc., can be modified by changing the relevant variables in namelist.wrf
Example 1
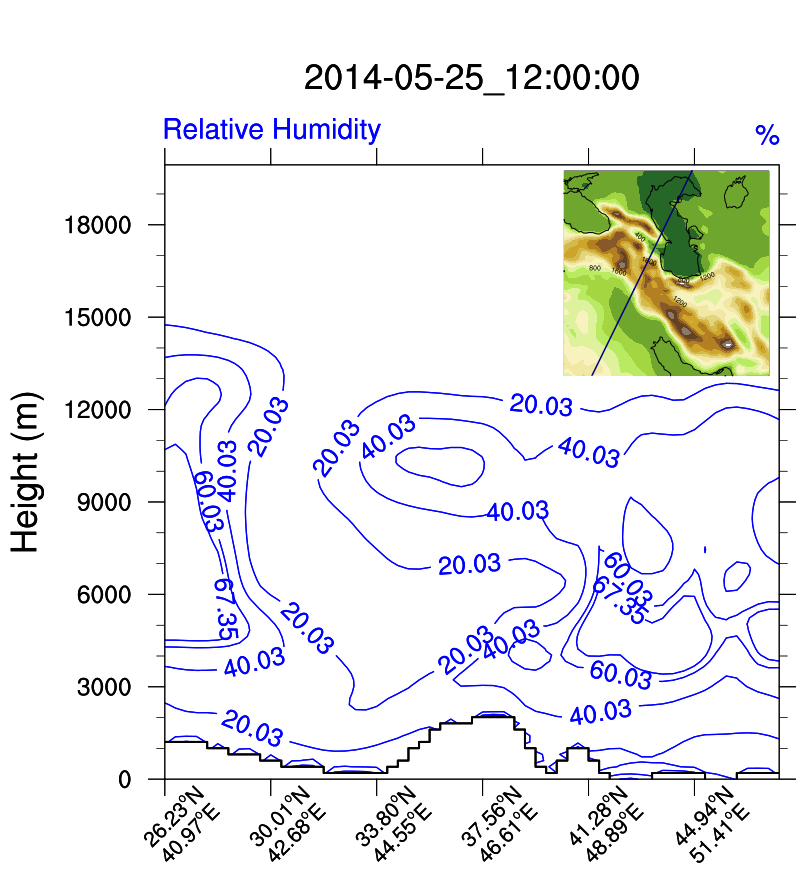
A set of line contours with the path of the cross-section:
============= CROSS SECTION PLOT ==============
===========================================
CROSSSECTION_ON-OFF = 1
CrossSection_path_on_off = 1
Topographic_map_on_off = 1
!!! 3D Variable_1 by line contours !!!
1st_var_on_off = 1
1st_var_name = rh
1st_var_intervals = 20
1st_var_line_color = blue
1st_var_line_thickness = 0.5
1st_var_label_size = 0.4
!!! 3D Variable_2 by (broken) line contours !!!
2nd_var_on_off = 0
2nd_var_name = (ua^2 + va^2)^0.5
2nd_var_intervals = 4
2nd_var_line_color = black
2nd_var_line_thickness = 0.5
2nd_var_label_size = 0.5
2nd_var_brokenline_on_off = 1
!!! 3D Variable_3 by filled (colored) contours !!!
3rd_var_on_off = 0
3rd_var_name = pvo
————————————————————————————————-
Output image at a specific time-slot in the WRF output is as bellow:
Example 2
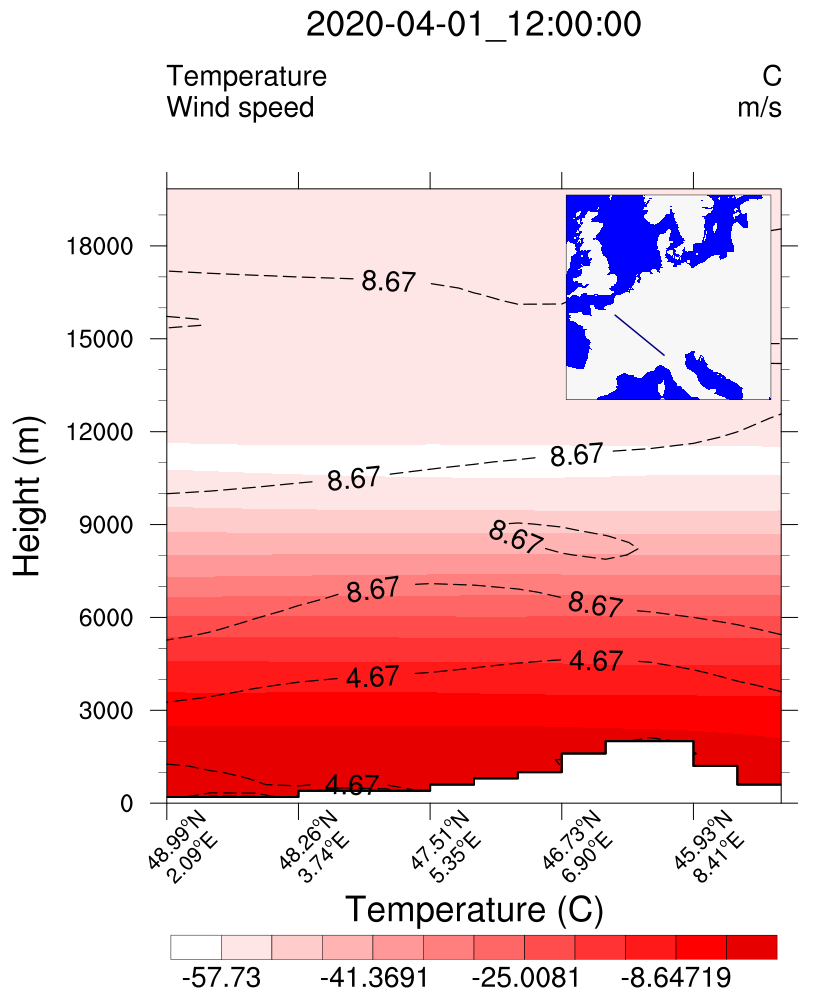
A set of line contours of a polynomial and a set of shaded contours, besides the path of the cross-section
============= CROSS SECTION PLOT ==============
===========================================
CROSSSECTION_ON-OFF = 1
CrossSection_path_on_off = 1
Topographic_map_on_off = 0
!!! 3D Variable_1 by line contours !!!
1st_var_on_off = 0
1st_var_name = rh
1st_var_intervals = 20
1st_var_line_color = blue
1st_var_line_thickness = 0.5
1st_var_label_size = 0.4
!!! 3D Variable_2 by (broken) line contours !!!
2nd_var_on_off = 1
2nd_var_name = (ua^2 + va^2)^0.5
2nd_var_intervals = 4
2nd_var_line_color = black
2nd_var_line_thickness = 0.5
2nd_var_label_size = 0.5
2nd_var_brokenline_on_off = 1
!!! 3D Variable_3 by filled (colored) contours !!!
3rd_var_on_off = 1
3rd_var_name = tc
————————————————————————————————-
Output image at a specific time-slot in the WRF output is as bellow:
Example 3
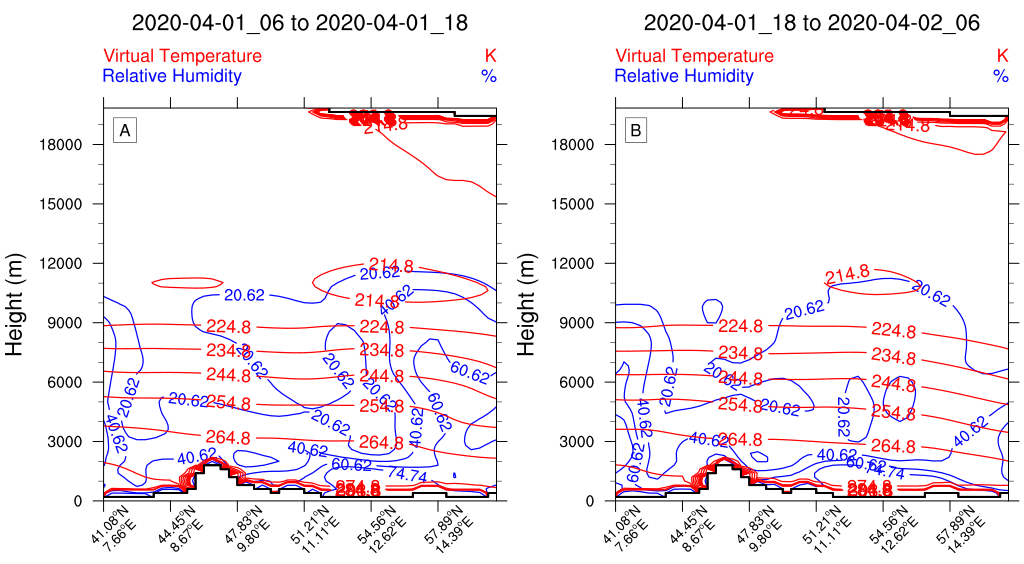
Average (12 hours) plots of Two sets of line contours, shown as a panel plot
============= CROSS SECTION PLOT ==============
===========================================
CROSSSECTION_ON-OFF = 1
CrossSection_path_on_off = 0
Topographic_map_on_off = 0
!!! 3D Variable_1 by line contours !!!
1st_var_on_off = 1
1st_var_name = rh
1st_var_intervals = 20
1st_var_line_color = blue
1st_var_line_thickness = 0.5
1st_var_label_size = 0.4
!!! 3D Variable_2 by (broken) line contours !!!
2nd_var_on_off = 1
2nd_var_name = tv
2nd_var_intervals = 10
2nd_var_line_color = red
2nd_var_line_thickness = 0.5
2nd_var_label_size = 0.5
2nd_var_brokenline_on_off = 0
!!! 3D Variable_3 by filled (colored) contours !!!
3rd_var_on_off = 0
3rd_var_name = tc
————————————————————————————————-
Panel plot is a capability of PostWRF which must be set in
the General settings section of namelist.wrf
============== GENERAL SETTINGS ===============
============================================
spin-up_time (hours) = 6
averaging_on_off = 1
average_time (hours) = 12
panel_plot__on_off = 1
panel_plot__rows_number = 1
panel_plot__columns_number = 2
smooth_maps_on_off = 1
map_borderline_color = black
map_borderline_thickness = 0.7
map_filled_ocean_on_off = 1
map_gridlines_on_off = 1
plot_titles_on_off = 1
————————————————————————————————-
Output image at a specific time-slot in the WRF output is as bellow: