Plotting WRF domains
Two methods are available in PostWRF to plot the WRF’s simulation domain:
Method 1
Using namelist.wps from the WRF Preprocessing System (WPS)
In this method a schematic map of the simulation domain will be plotted.
=============== DOMAIN MAP ================
===========================================
Domain_On-Off = 1
namelist.wps_path (schematic) = /home/anikfal/wrf/WPS/namelist.wps
background_color (schematic) = forestgreen
lables_On-Off (schematic) = 0
+Domain_on_off (topography) = 0
+number_of_domains (topography) = 2
+box_color = white
————————————————————————————-
Output image at a specific time-slot in the WRF output is as bellow:
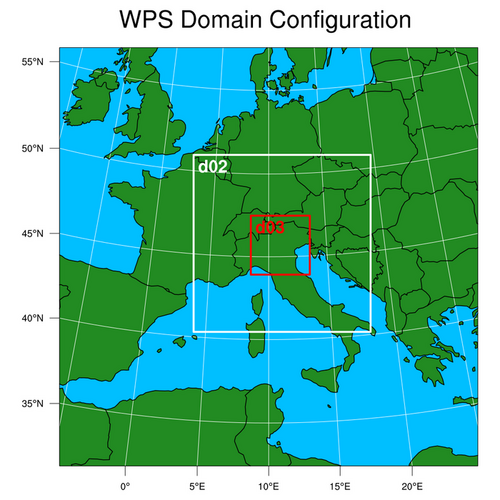
Schematic domain, plotted by reading namelist.wps
Method 2
Using the model’s outputs, which could be the outputs of geogrid.exe, metgrid.exe, or wrf.exe
In this method the WRF simulation domain will be plotted as a topography map.
=============== DOMAIN MAP ================
===========================================
Domain_On-Off = 1
namelist.wps_path (schematic) = /home/anikfal/wrf/WPS/namelist.wps
background_color (schematic) = forestgreen
lables_On-Off (schematic) = 0
+Domain_on_off (topography) = 1
+number_of_domains (topography) = 2
+box_color = white
————————————————————————————-
Output image at a specific time-slot in the WRF output is as bellow:
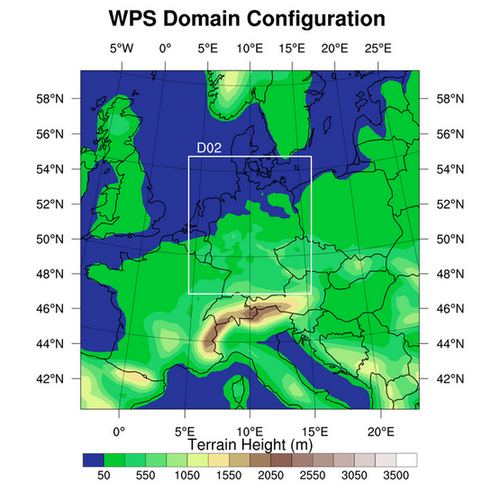
WRF domains, plotted directly by reading the WRF output files