ERA5 Contour plots
A combination of three variables, as well as wind vectors and location markers,
could be plotted by PostWRF.
Moreover, the user can plot the whole domain or a specified sub-domain by turning on ERA5_SubDomain_on_off and setting
the relevant variables (Min_lat, Max_lat, Min_lon, and Max_lon)
Note
ERA5 data must be downloaded as NetCDF format
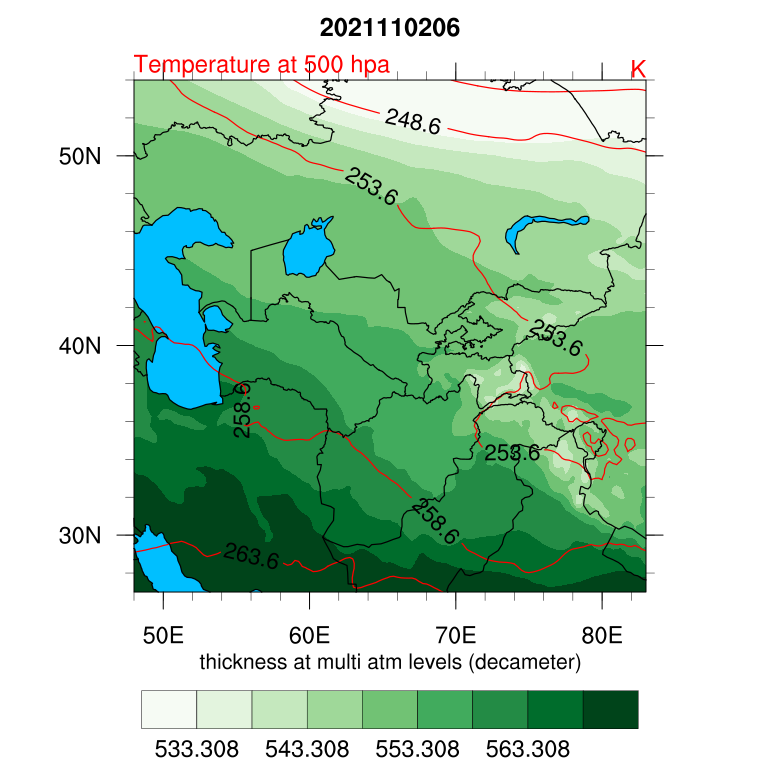
Example 1
A group of line contours (temperature) overlaid on a group of filled contours (geopotential thickness between 500 and 1000 hpa)
============== ERA5 CONTOUR PLOT ===============
=============================================
ERA5_ON_OFF = 1
!!! Variable_1 by line contours !!!
1st_ERA5_Var_on_off = 1
1st_ERA5_Var_name = t
1st_ERA5_Var_pressure_level = 500
1st_ERA5_Var_intervals = 5
1st_ERA5_Var_line_color = red
1st_ERA5_Var_line_thickness = 0.5
1st_ERA5_Var_label_size = 0.3
!!! Variable_2 by (broken) line contours !!!
2nd_ERA5_Var_on_off = 0
2nd_ERA5_Var_name = t+r
2nd_ERA5_Var_pressure_level = 333
2nd_ERA5_Var_intervals = 0
2nd_ERA5_Var_line_color = red
2nd_ERA5_Var_line_thickness = 0.8
2nd_ERA5_Var_label_size = 0.3
2nd_ERA5_Var_brokenline_on_off = 1
!!! Variable_3 by filled (colored) contours !!!
3rd_ERA5_Var_on_off = 1
3rd_ERA5_Var_name = (z-z)/98.1
3rd_ERA5_Var_pressure_level = 500, 1000
Wind_ERA5_on_off = 0
Wind_ERA5_pressure_level = 333
Wind_ERA5_speed (m/s) = 10
Wind_ERA5_density = 0.5
Wind_ERA5_color = blue
Wind_ERA5_thickness = 0.5
ERA5_point_mark_on_off = 0
ERA5_labels_on_off = 1
ERA5_labels_size = 0.3
ERA5_labels_color = black
ERA5_Shapefile_on_off = 0
ERA5_shapefile_path = /home/anikfal/shapefiles/anzali_swamp.shp
ERA5_SubDomain_on_off = 0
Min_lat = 30
Max_lat = 50
Min_lon = 60
Max_lon = 70
—————————————————————————–
Output image at a specific time-slot in the ERA5 NetCDF file is as bellow:
Please notice that unlike the WRF outputs, for ERA5 files, pressure levels are not interpolated.
Therefor if the input pressure level is not in the file (e.g. 333), the nearest pressure level to this value will be selected.
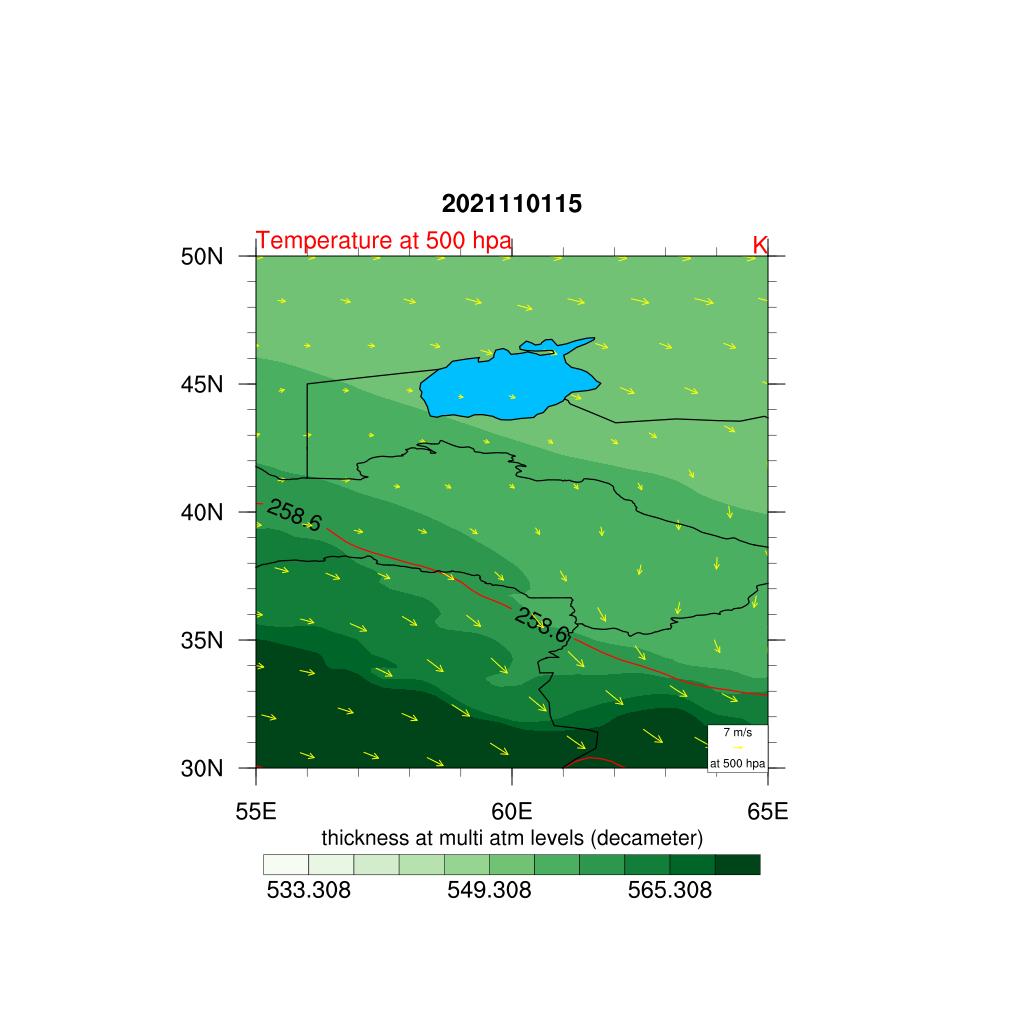
Example 2
Similar to example one, but with overlaid wind vectors, with sub-domain
Same as WRF outputs, location labels, as well as shapefiles can also be overlaid on the plots
============== ERA5 CONTOUR PLOT ===============
=============================================
ERA5_ON_OFF = 1
!!! Variable_1 by line contours !!!
1st_ERA5_Var_on_off = 1
1st_ERA5_Var_name = t
1st_ERA5_Var_pressure_level = 500
1st_ERA5_Var_intervals = 5
1st_ERA5_Var_line_color = red
1st_ERA5_Var_line_thickness = 0.5
1st_ERA5_Var_label_size = 0.3
!!! Variable_2 by (broken) line contours !!!
2nd_ERA5_Var_on_off = 0
2nd_ERA5_Var_name = t+r
2nd_ERA5_Var_pressure_level = 333
2nd_ERA5_Var_intervals = 0
2nd_ERA5_Var_line_color = red
2nd_ERA5_Var_line_thickness = 0.8
2nd_ERA5_Var_label_size = 0.3
2nd_ERA5_Var_brokenline_on_off = 1
!!! Variable_3 by filled (colored) contours !!!
3rd_ERA5_Var_on_off = 1
3rd_ERA5_Var_name = (z-z)/98.1
3rd_ERA5_Var_pressure_level = 500, 1000
Wind_ERA5_on_off = 1
Wind_ERA5_pressure_level = 500
Wind_ERA5_speed (m/s) = 7
Wind_ERA5_density = 0.5
Wind_ERA5_color = yellow
Wind_ERA5_thickness = 0.5
ERA5_point_mark_on_off = 0
ERA5_labels_on_off = 1
ERA5_labels_size = 0.3
ERA5_labels_color = black
ERA5_Shapefile_on_off = 0
ERA5_shapefile_path = /home/anikfal/shapefiles/anzali_swamp.shp
ERA5_SubDomain_on_off = 1
Min_lat = 30
Max_lat = 50
Min_lon = 55
Max_lon = 65
—————————————————————————–
Output image at a specific time-slot in the WRF output is as bellow:
Example 3
Panel plot of a shaded and a line contour
============== ERA5 CONTOUR PLOT ===============
=============================================
ERA5_ON_OFF = 1
!!! Variable_1 by line contours !!!
1st_ERA5_Var_on_off = 0
1st_ERA5_Var_name = t
1st_ERA5_Var_pressure_level = 500
1st_ERA5_Var_intervals = 5
1st_ERA5_Var_line_color = red
1st_ERA5_Var_line_thickness = 0.5
1st_ERA5_Var_label_size = 0.3
!!! Variable_2 by (broken) line contours !!!
2nd_ERA5_Var_on_off = 0
2nd_ERA5_Var_name = t+r
2nd_ERA5_Var_pressure_level = 333
2nd_ERA5_Var_intervals = 0
2nd_ERA5_Var_line_color = red
2nd_ERA5_Var_line_thickness = 0.8
2nd_ERA5_Var_label_size = 0.3
2nd_ERA5_Var_brokenline_on_off = 1
!!! Variable_3 by filled (colored) contours !!!
3rd_ERA5_Var_on_off = 1
3rd_ERA5_Var_name = vo
3rd_ERA5_Var_pressure_level = 500
Wind_ERA5_on_off = 0
Wind_ERA5_pressure_level = 500
Wind_ERA5_speed (m/s) = 7
Wind_ERA5_density = 0.5
Wind_ERA5_color = yellow
Wind_ERA5_thickness = 0.5
ERA5_point_mark_on_off = 0
ERA5_labels_on_off = 1
ERA5_labels_size = 0.3
ERA5_labels_color = black
ERA5_Shapefile_on_off = 0
ERA5_shapefile_path = /home/anikfal/shapefiles/anzali_swamp.shp
ERA5_SubDomain_on_off = 0
Min_lat = 30
Max_lat = 50
Min_lon = 55
Max_lon = 65
—————————————————————————–
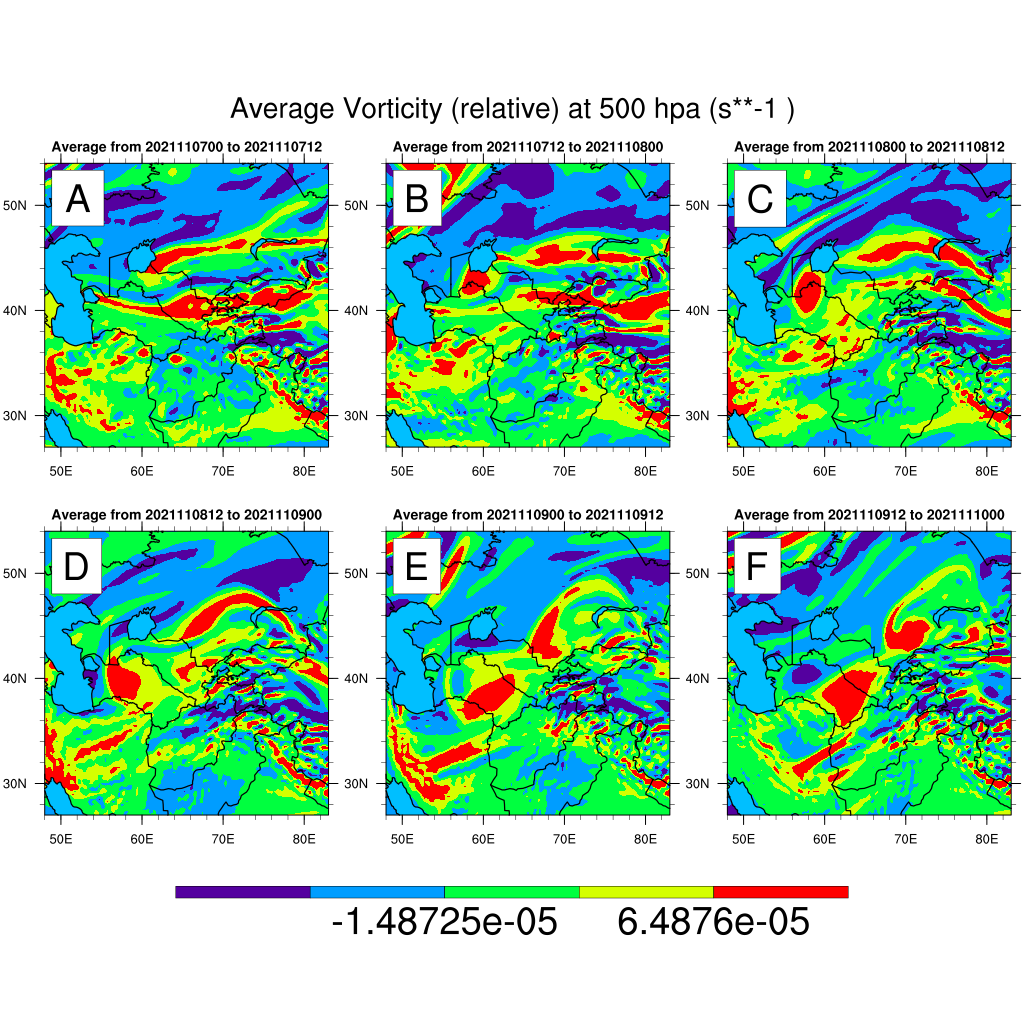
Panel plot is a capability of PostWRF which must be set in
the General settings section of namelist.wrf
============== GENERAL SETTINGS ===============
=============================================
spin-up_time (hours) = 6
averaging_on_off = 1
average_time (hours) = 12
panel_plot__on_off = 1
panel_plot__rows_number = 2
panel_plot__columns_number = 3
smooth_maps_on_off = 1
map_borderline_color = black
map_borderline_thickness = 0.7
map_filled_ocean_on_off = 1
map_gridlines_on_off = 1
plot_titles_on_off = 0
————————————————————————————————-
Output images of vorticity by 12 hour average, as panel plots: